


The volume of life-science literature now exceeds the capacity of any individual or institution to evaluate systematically: Over 1.5 million papers are published in biomedicine and life sciences every year [1]. Yet the signals routinely used to judge an individual paper, such as journal impact factor or citation count, accumulate slowly, carry well-documented biases, or are simply unavailable for early work or preprints. QED Science (QED) introduces QED Score, an AI-based quality metric for life-science manuscripts that anonymizes and assesses two dimensions of a manuscript, its originality and its validity.
Abstract
We evaluated QED Score in three independent studies:
(i) On a professionally labelled corpus of 925 papers judged by a panel of experts QED Score separated Limited from Strong or Satisfactory papers with an AUC of 0.867.
(ii) Across 2,879 bioRxiv preprints matched to their ultimate published versions, QED Score (computed on the preprint, using language models whose knowledge cut-offs predated the corpus to exclude data contamination) correlated with the SCImago Journal Rank (SJR) of the publication venue at Spearman ρ = 0.63.
(iii) In a blinded head-to-head study, 15 domain-experts compared paper pairs in which QED Score and journal rank disagreed; among 60 decisive judgements, experts preferred the QED-favored paper in 75% of cases (two-sided exact sign test p < 0.001; 95% Wilson CI 63%–84%), 3× more often.
Together these results demonstrate that QED Score, an AI-generated quality score, is a more accurate, faster, and less biased estimate of paper quality than journal rank, and a useful augmentation of expert judgement.
1. Introduction
Judging the quality of scientific papers is an extremely hard task. Doing it well requires unique expertise in a narrow domain, advanced scientific reasoning, and current, comprehensive familiarity with a large and fast-growing body of literature.
Formal external peer review (standardized across major journals only in the late twentieth century [2]), is the best mechanism we have for establishing the quality of a manuscript. However, multiple studies have shown the agreement between independent reviewers on whether to accept, revise, or reject a manuscript is poor across multiple domains [3,4]. Grant review fares no better: an experiment in which 150 proposals submitted to the National Science Foundation were evaluated independently by a new set of reviewers indicates that getting a research grant depends to a significant extent on chance [5]. In 2012, the now-famous Amgen study reported that when researchers tried to reproduce 53 landmark published preclinical cancer studies, they confirmed the findings in only six [6]; formal analysis has argued that, under common conditions, most published findings are false [7]. We all rely on the accumulated peer-reviewed body of work, yet much of it is unvalidated, fragmented, and at times contradictory.
The scientific corpus represents humanity's best attempt to understand the natural world and its judgement underwrites decisions across technology, the life sciences, medicine, and more. The same imperfect assessment that informs which experiment to run, which pharmacological target to prioritize, or which clinical indication to pursue also governs hiring, promotion, and funding, where a single evaluation of a body of work can redirect a career or an entire research programme.
The problem is exacerbated with the advent of AI. Frontier AI models and the agents built on them now draw on the same literature to reason, plan, and act, inheriting any and all errors directly. When the underlying work is unreliable, so are the conclusions, whether they are reached by a person or a machine.
The dominant approach for judging quality is journal rank — the prestige of the venue in which a paper appears, captured by metrics such as the SCImago Journal Rank (SJR) and the Journal Impact Factor [see Appendix A] . It remains widely used despite well-established limitations:
- Availability lag. Journal rank does not exist for preprints, and citation-based metrics take years to stabilize.
- Prestige and identity bias. Venue placement is influenced by author reputation and institutional affiliation independently of paper quality [8].
- Venue-level resolution. A journal rank assigns the same value to every paper in a journal; even major journals explicitly acknowledge that the impact factor does not adequately represent the distribution of citations among individual articles, with most papers receiving far fewer citations than the journal average [9].
- Peer-review latency. First peer-reviewed decisions in health and biomedical journals take a median of 60 days, with full submission-to-publication times ranging from about three months to nearly two years, leaving preprints unassessed throughout [10,11].
- Claim-level resolution. A quality mark applies to the paper as a whole and cannot discriminate among the individual claims it contains. A single article may advance five to ten distinct claims, one of which rests on weak evidence, yet venue prestige and citation counts attach to the paper rather than to any specific assertion.
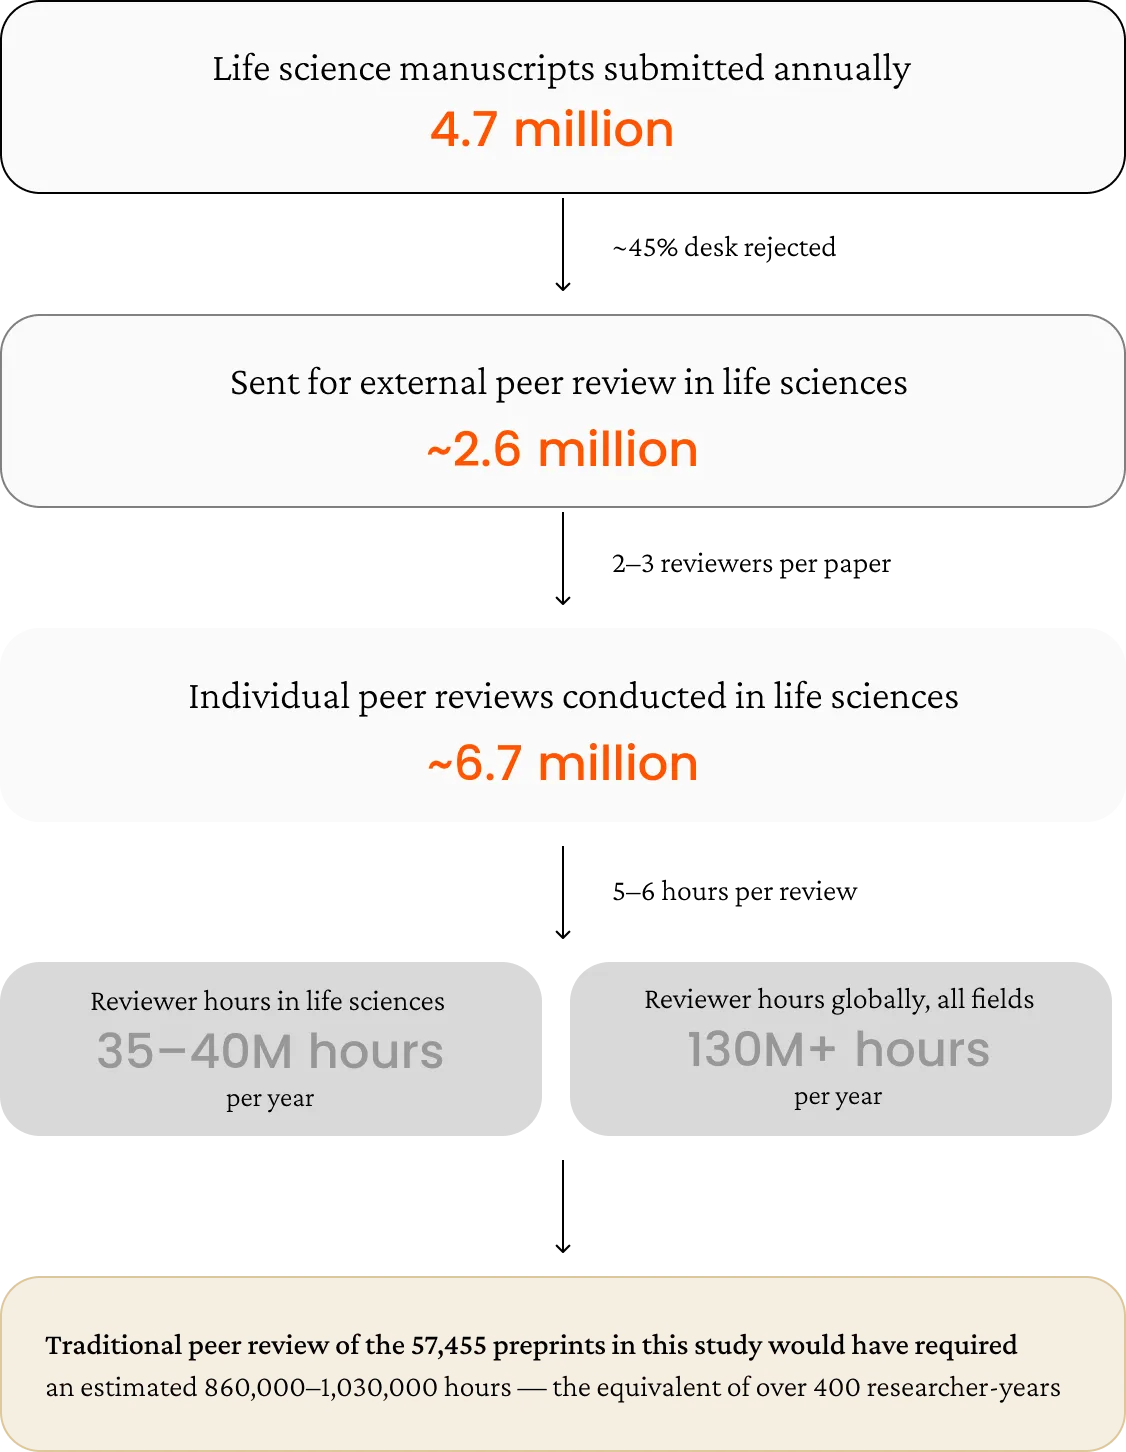
The scale of this bottleneck is substantial. Over 1.5 million papers are published in biomedicine and life sciences every year, and with a mean journal acceptance rate of approximately 32% [12], an estimated 4.7 million manuscripts enter the submission pipeline annually, the majority proceeding to external peer review.
In the life sciences, applying published estimates of submission volumes, review rates, and reviewer time to the current annual output of 1.5 million papers yields an estimated 35–40 million hours of peer review labour annually, a figure that, by the same methodology applied to all academic fields globally, reaches over 130 million hours [13]. Here, for the first time, we report the construction and evaluation of QED Score, an AI-based quality metric that evaluates the originality and validity of a life-science manuscript in minutes, from its text alone, independent of author identity, institutional affiliation, or publication venue.
QED Score differs from prior efforts to assess scientific work automatically in both domain and difficulty. Most existing AI-based review systems are built and validated on computer-science conference submissions such as those to ICLR and NeurIPS [14,15], where writing conventions, evaluation criteria, and a binary accept/reject ground truth differ markedly from the experimental life sciences.
Life-science manuscripts, grounded in wet-lab evidence, mechanistic claims, and field-specific reporting standards, have received comparatively little attention.
The two settings also differ in difficulty. A system benchmarked against accept/reject decisions earns much of its apparent accuracy by flagging weak or clearly flawed submissions, a comparatively easy separation. Our discriminative benchmark, by contrast, contains only papers already accepted and published in reputable journals (mean SJR 8.4), so even the lowest tier is competent, peer-reviewed work. QED Score is therefore tested on its ability to grade quality within the accepted literature rather than to filter out obvious rejects. Demonstrating this finer-grained discrimination is a substantially harder, and we argue more useful, task than predicting a binary publication outcome.
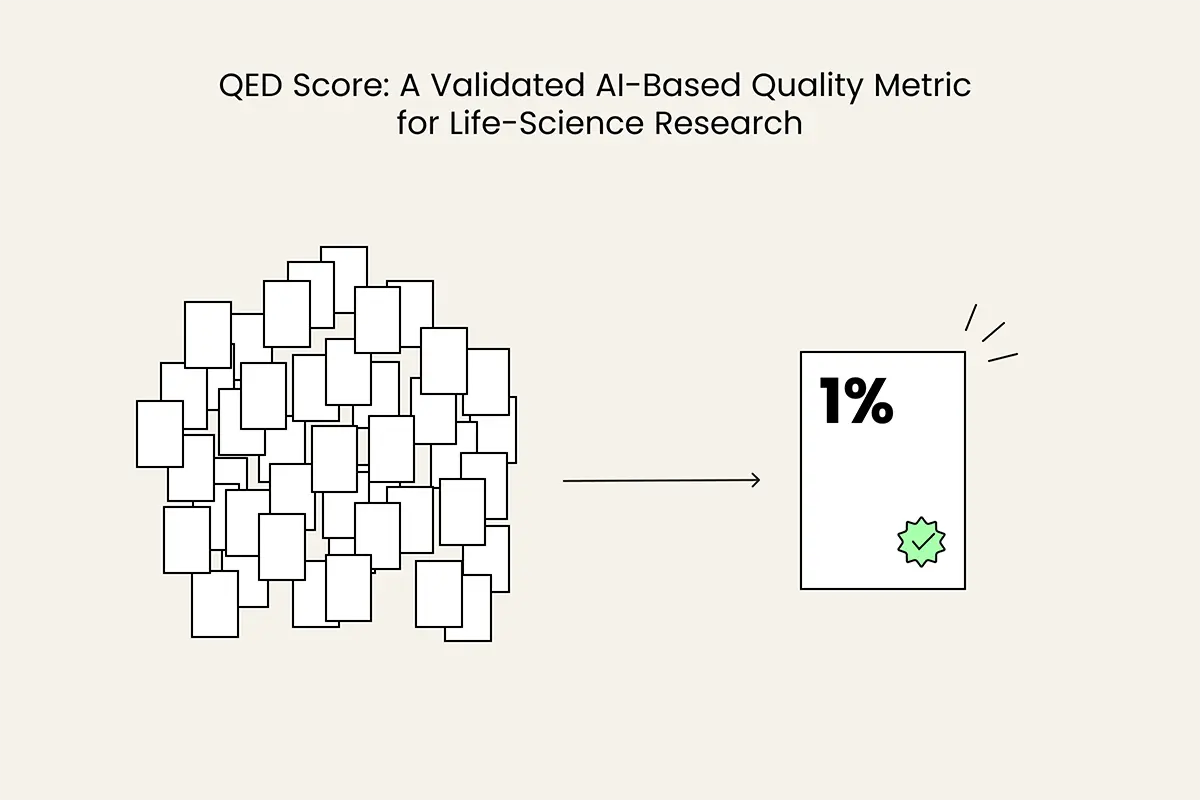
QED Score is the foundation for QED Science’s The 1%, a comprehensive study of 57,455 manuscripts spanning a full year of scientific output. Reviewing the 57,455 preprints evaluated in this study through traditional peer review would have required an estimated 860,000 to 1,030,000 hours of expert time, the equivalent of over 400 researcher-years. QED Score completed equivalent assessments in hours. To our knowledge this represents the single largest effort to assess the quality of manuscripts based on their underlying science in a standardized way at scale, and the implications are vast.
A Direct Application of QED Score: The 1%
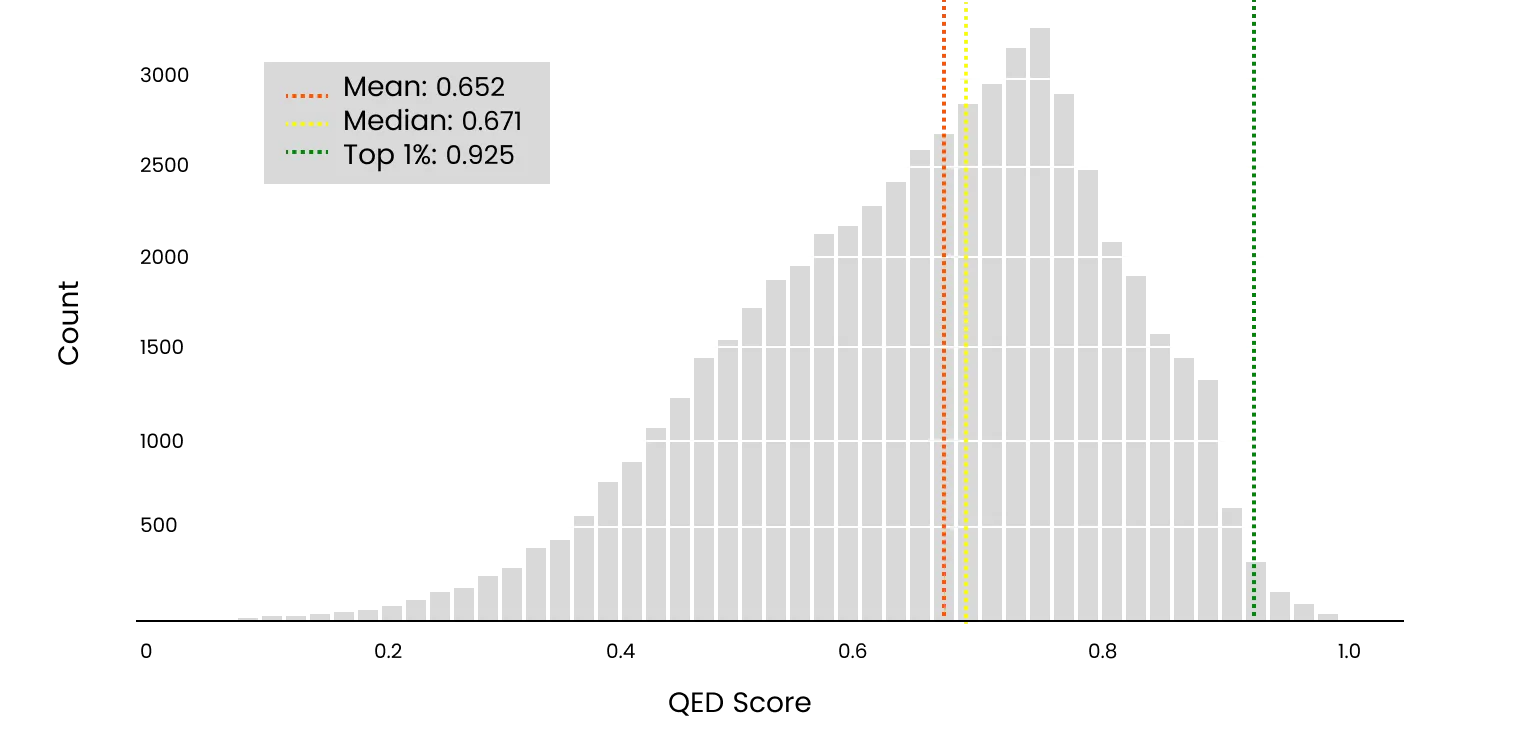
The 1% is a direct application of QED Score methodology. Following validation, QED Score was applied at scale to 57,455 bioRxiv preprints published between May 2025 and April 2026, representing a near-complete census of life science preprint output over a twelve-month period. Every manuscript was processed in anonymized form, with author names and affiliations removed prior to scoring. Papers were evaluated on originality and validity, the two dimensions validated in our studies. For each manuscript, a raw QED Score was computed across these two dimensions. The resulting distribution is shown in Figure 2.
The papers scored at the very top of that distribution constitute The 1%. These are the preprints that represent the most original and valid contributions to life science in the study period. We scored works across all 25 life science disciplines covered by the bioRxiv taxonomy, from Genetics and Molecular Biology to Ecology and Systems Biology, with representation varying by field.
This distribution is not a one-time exercise. QED Science intends to make individual paper scoring available to all researchers, enabling authors to submit their work and see how it ranks against the full reference corpus of scored preprints, giving every scientist, regardless of institution or resources, access to the same unbiased quality signal.
The 1% is not a substitute for peer review, and it does not claim to be. It is a fast, blind, paper-level quality signal applied to work that has not yet been formally assessed. For researchers, it offers early recognition independent of institutional affiliation or publication venue. For the scientific community, it offers a curated signal: a starting point for identifying the work most worth attention in a literature that no individual can read in full.
2. The QED Review and Score System
QED Score is produced by a multi-agent AI architecture combining multiple large language models (LLMs) with proprietary models. As of 31 May 2026 the platform was in use by more than 10,000 laboratories across over 1,500 institutions in more than 70 countries. The studies reported here use the scoring pipeline as deployed.
Each manuscript is first decomposed into structured components; a meta-claim, the main claims, related claims, and the experiments supporting each. The system evaluates these extracted claims and their supporting evidence rather than the prose itself, moving away from writing style and journal-specific formatting. Because author identity and institutional prestige are a known and persistent source of bias in quality assessment, every manuscript is processed in anonymized form by an automated anonymizer, with author names and affiliations removed before scoring.
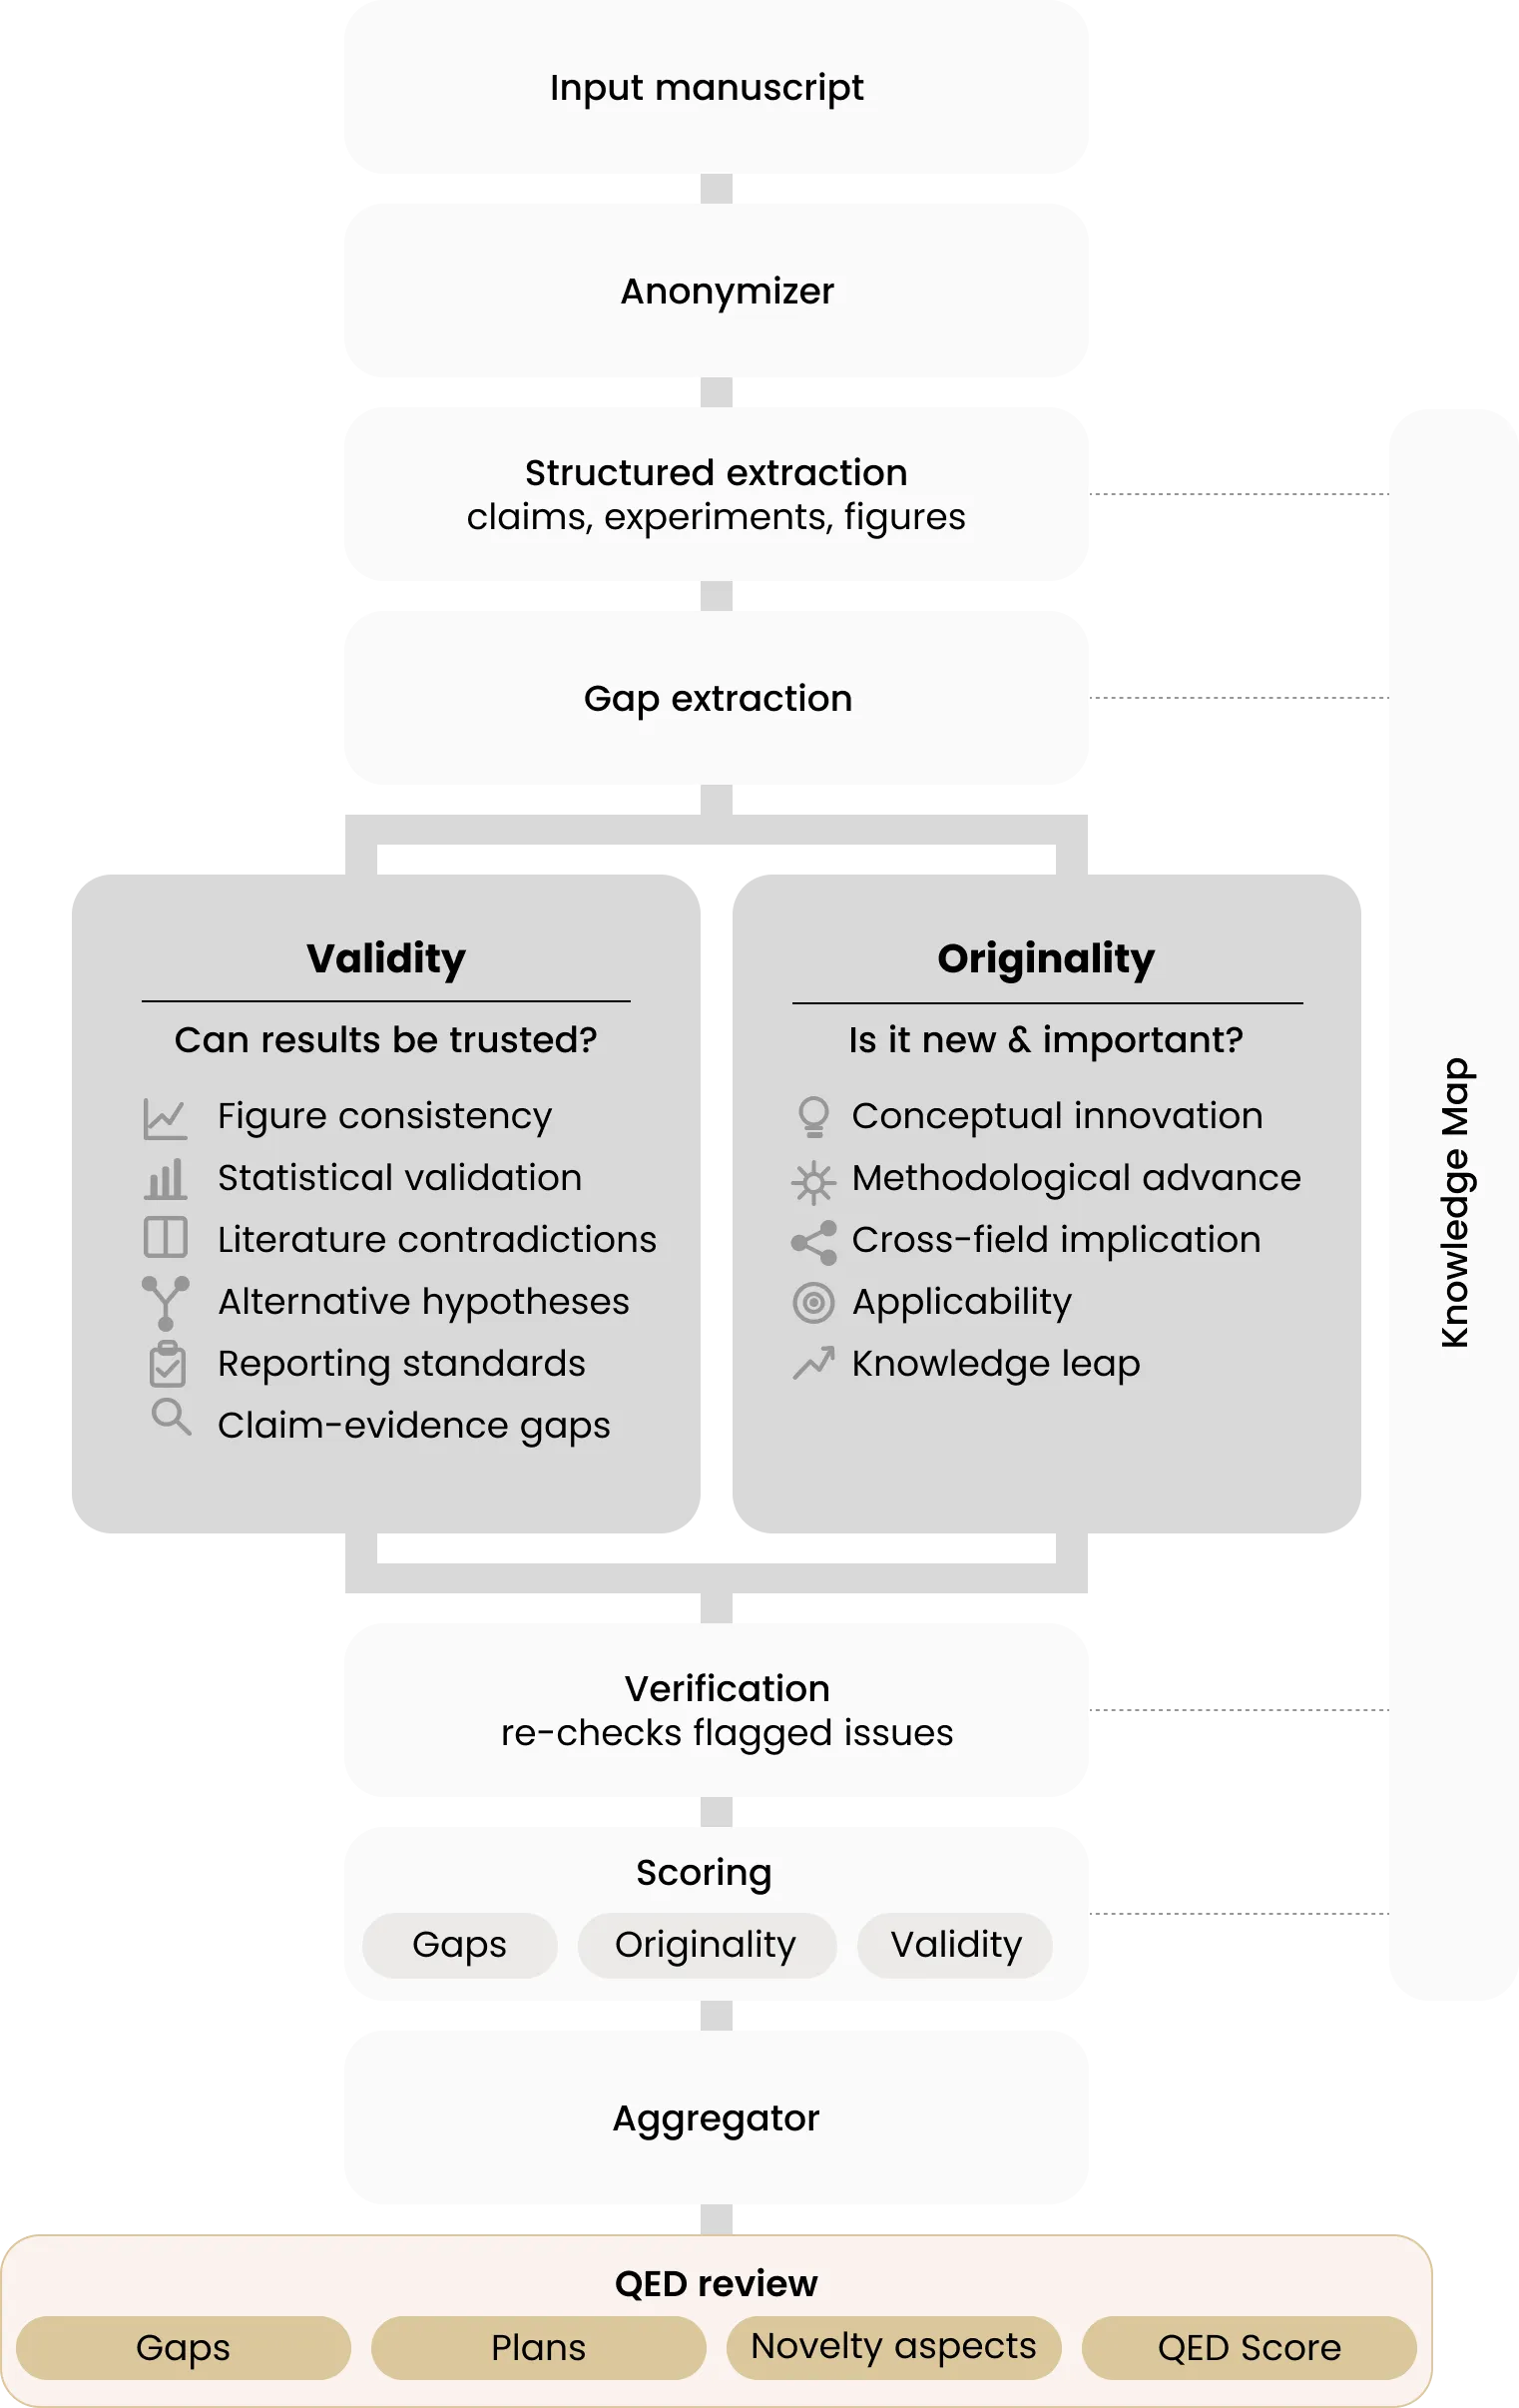
A panel of specialized agents then examines the manuscript in parallel, each probing a distinct dimension: inconsistencies across figures, soundness of statistical validation, contradictions with the existing literature, plausible alternative hypotheses, adherence to field reporting standards, and others. These agents draw on a contextual knowledge map that situates the work within its broader scientific landscape. Their findings pass through a verification layer that re-checks each flagged issue, a scoring layer that grades each claim, and an aggregator that synthesizes the result into a single calibrated QED Score.
QED Score reflects two dimensions, each assessed through multi-factor analysis rather than a single judgement:
- Originality (is the finding new and important?). Evaluated across conceptual innovation, methodological advancement, cross-field implications, applicability, and the size of the knowledge leap, with genuine conceptual and knowledge-based leaps weighted above incremental refinements. We ask, what part of the work is new, what does it add over previous work in its field, and what is the importance of this addition?
- Validity (can the results be trusted?). Assessed on two fronts. First, the soundness of the work itself, the design of its experiments, the rigor of its statistical analysis, and its adherence to the reporting standards of its field. Second, the strength of the evidence relative to the manuscript's key claims: whether the data actually support the conclusions drawn, surfacing the gaps where a claim outruns the evidence offered for it. A manuscript scores well on validity only when its central claims are both methodologically sound and supported by its results. Validity is in the context of existing literature, with extraordinary claims requiring extraordinary evidence.
Each dimension is scored independently and assigned a specific weight reflecting its contribution to overall quality; the weighted dimension scores are then combined into a single raw score for the manuscript.
In this paper, we share three rigorous scientific studies designed to validate QED Score from multiple angles.
3. Studies and Methodology
3.1 Study 1 — Internal discriminative benchmark
We obtained a professionally labelled corpus of 925 papers. Each paper was assigned a quality tier (Limited, Satisfactory, or Strong) by a panel of expert reviewers, following a defined protocol:
- Papers were independently reviewed by 2 domain experts, who were assigned to papers on the basis of subject-matter expertise so that every paper was judged by reviewers competent in its field.
- Each reviewer was assigned a tier, based on two explicit criteria: originality and validity.
- Where reviewers disagreed, the discrepancy was resolved by panel discussion to consensus.
Importantly, all papers (including those labelled Limited) were published in reputable journals (mean SJR of the corpus 8.4). The benchmark therefore tests discrimination among quality levels within the already-published literature, not between published and unpublished work; a Limited paper here is still a competent, peer-reviewed contribution, simply at the lower end of this distribution.
Discrimination was quantified by AUC [see Appendix A] for two contrasts, Limited vs. (Satisfactory + Strong), and Strong vs (Limited + Satisfactory), with 95% bootstrap confidence intervals (2,000 iterations).
3.2 Study 2 — Correlation with journal rank at scale
We collected 4,953 bioRxiv preprints from April 2025 and scored each with QED Score. Of these, 2,879 (58%) were subsequently matched to a published version carrying an associated SJR value. The 58% match rate is consistent with expected one-year preprint-to-publication conversion. bioRxiv reports that more than 50% of preprints are published within one year of posting, indicating the matched subset is not selectively sampled [16].
A central risk for any AI scoring system is that the model may have seen the papers it evaluates during training, inflating performance. To eliminate this, QED Scores for this study were generated exclusively with models whose knowledge cut-offs predate the April 2025 corpus, so every paper was unseen by the underlying models at scoring time. No later literature was available to the system via retrieval. The resulting correlation therefore reflects genuine predictive ability on new work, not pattern-matching against previously encountered papers.
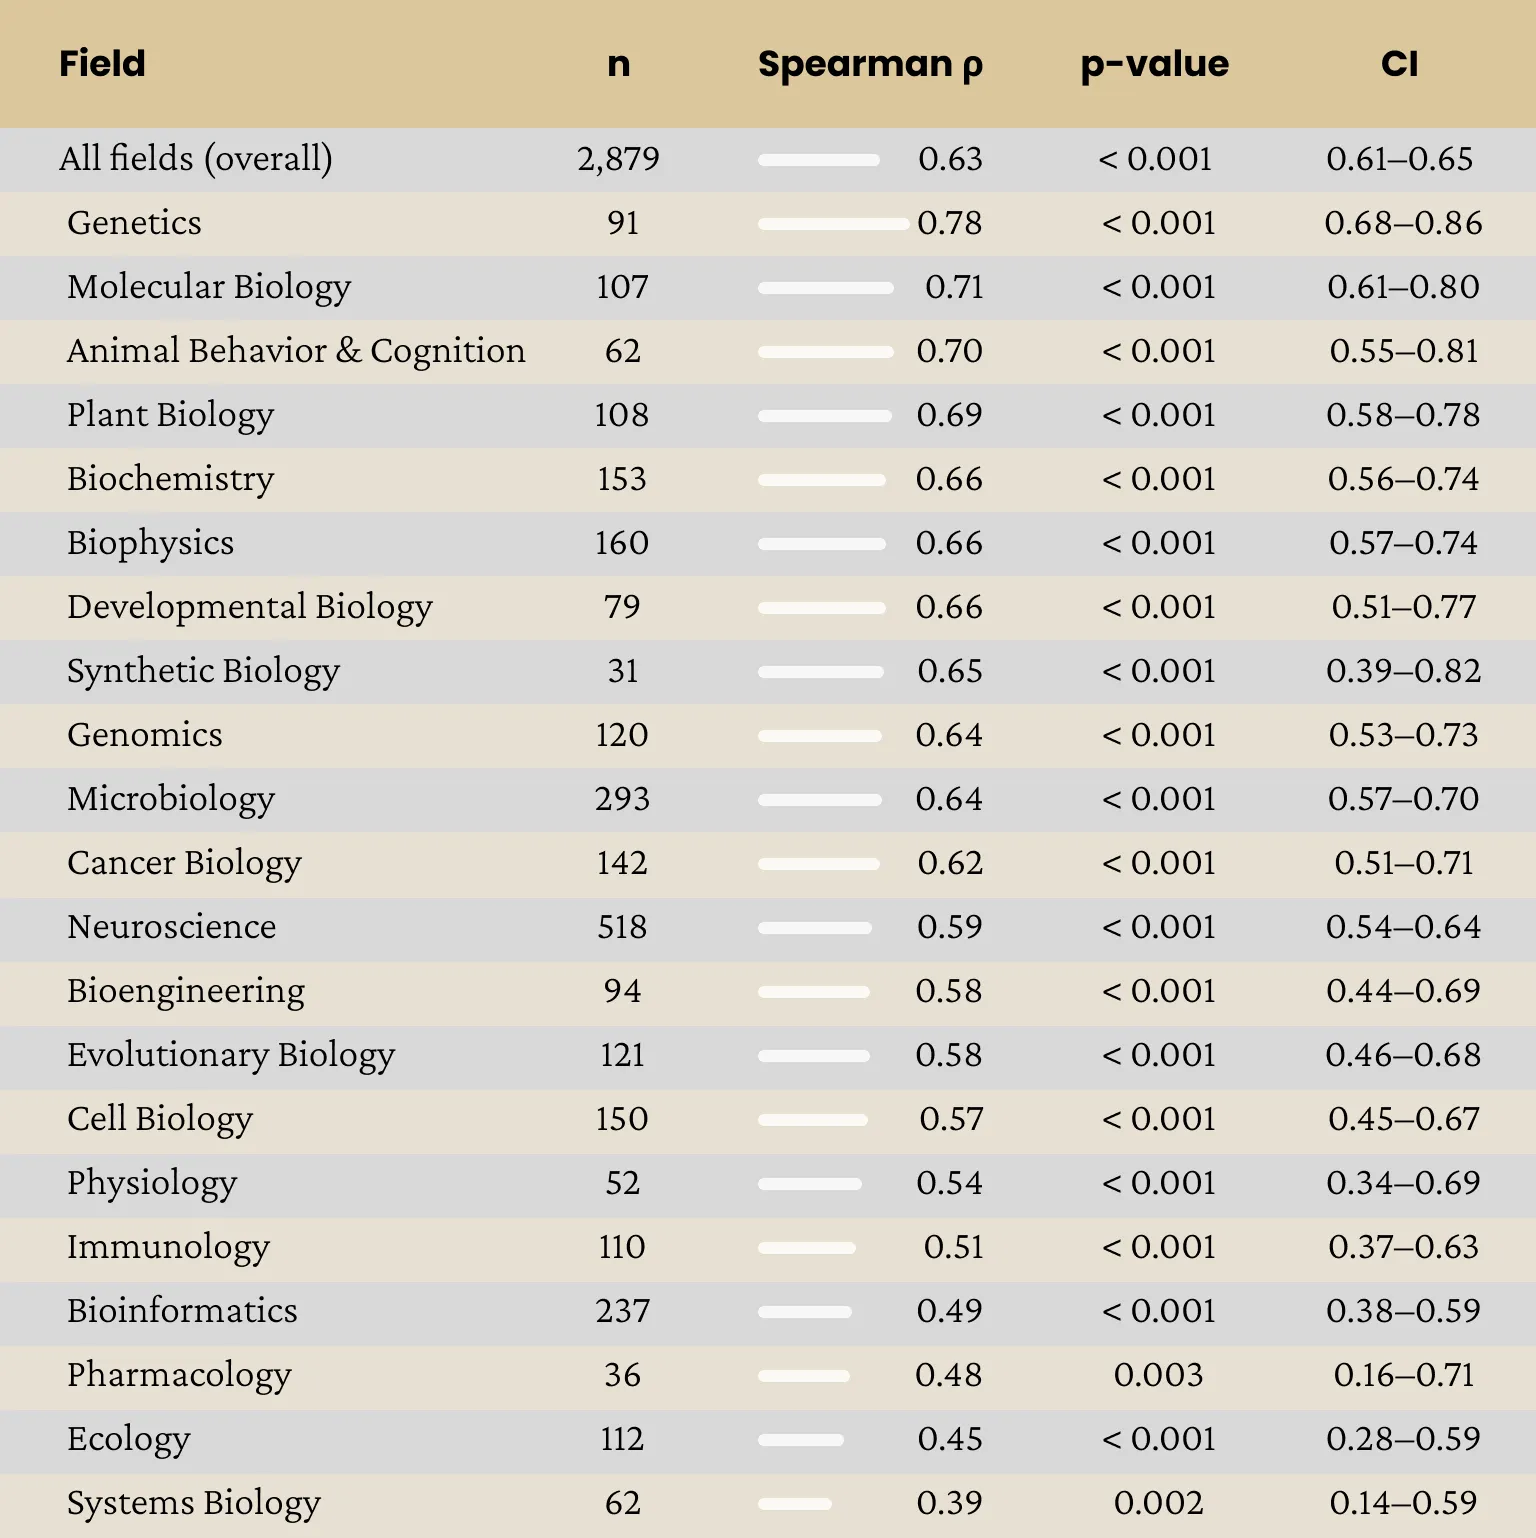
Association between the preprint QED Score and the SJR of the eventual venue was measured by Spearman's ρ [See Appendix A]. We computed this association both overall and within individual sub-fields, the life-science disciplines into which bioRxiv sorts its preprints (for example Genetics, Neuroscience, Bioinformatics, or Ecology). We assigned each paper to a sub-field by its bioRxiv subject category. Sub-fields were analysed separately only where the matched sample was large enough to give a stable estimate (n ≥ 30 matched papers); smaller categories were reported in the overall figure but not broken out individually.
3.3 Study 3 — Blinded head-to-head expert comparison
QED Score and journal rank broadly track one another, but for a meaningful share of papers they diverge, ie: A lower-venue paper that QED Score ranks highly, or vice versa. These disagreements are the most informative test of the metric: where the two signals point in opposite directions, only one can be the better reflection of the paper's true quality. This study was designed to determine which, by asking blinded domain experts to judge the science directly on pairs constructed to maximize that disagreement.
From the matched preprint corpus we constructed 100 paper pairs. Each pair was drawn from a single subject area where there was a large gap in both QED Score and SJR, with the two gaps pointing in opposite directions: the paper rated higher by QED Score had been published in the lower-ranked journal, and vice versa. To rank candidate pairs we scored every possible pairing by the product of the difference in log1p(SJR) [See Appendix A] and the difference in QED Score, and retained the 100 strongest contradictions.
15 domain-experts (primarily professors) evaluated pairs within their own areas of expertise. Pairs were presented as bioRxiv PDFs in randomized order, with all venue information withheld; experts were instructed not to look up where any paper had been published, and judged only those pairs they felt confident assessing. For each pair they chose the stronger paper on the basis of originality and validity. Journal identities and QED Scores were unsealed only after each judgement was recorded, so neither signal could influence the verdict.
Preferences were analysed with a two-sided exact sign test against equal preference (0.50), with Wilson 95% confidence intervals. Ties were handled both by exclusion (decisive analysis) and as half-credit (sensitivity analysis).
4. Results
4.1 Study 1 — QED Score discriminates between expert quality tiers
QED Score agreed closely with expert tiering. On the full n=925 corpus, QED Score separated Limited papers from the rest with a paper-level AUC of 0.867, and separated Strong papers from the rest with a paper-level AUC of 0.790 (chance baseline = 0.50.)
These results indicate that QED Score is in substantive agreement with human expert quality judgements.
To benchmark QED Score against the best available alternative signal, we also computed SJR-based AUC on the subset of papers for which a journal SJR value could be retrieved. Of the 925-paper corpus, 795 papers (86%) were matched to a published journal with an associated SJR value. All comparisons between QED Score and SJR in Table 1 are computed on this matched subset.
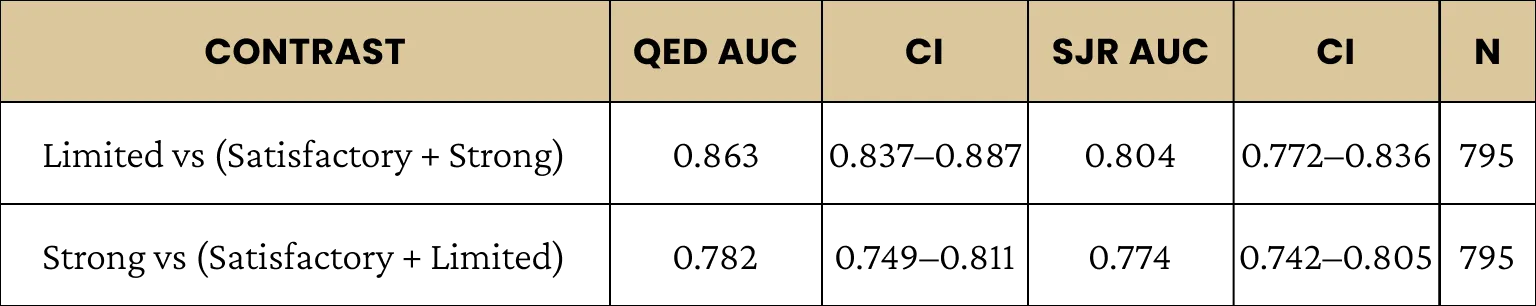
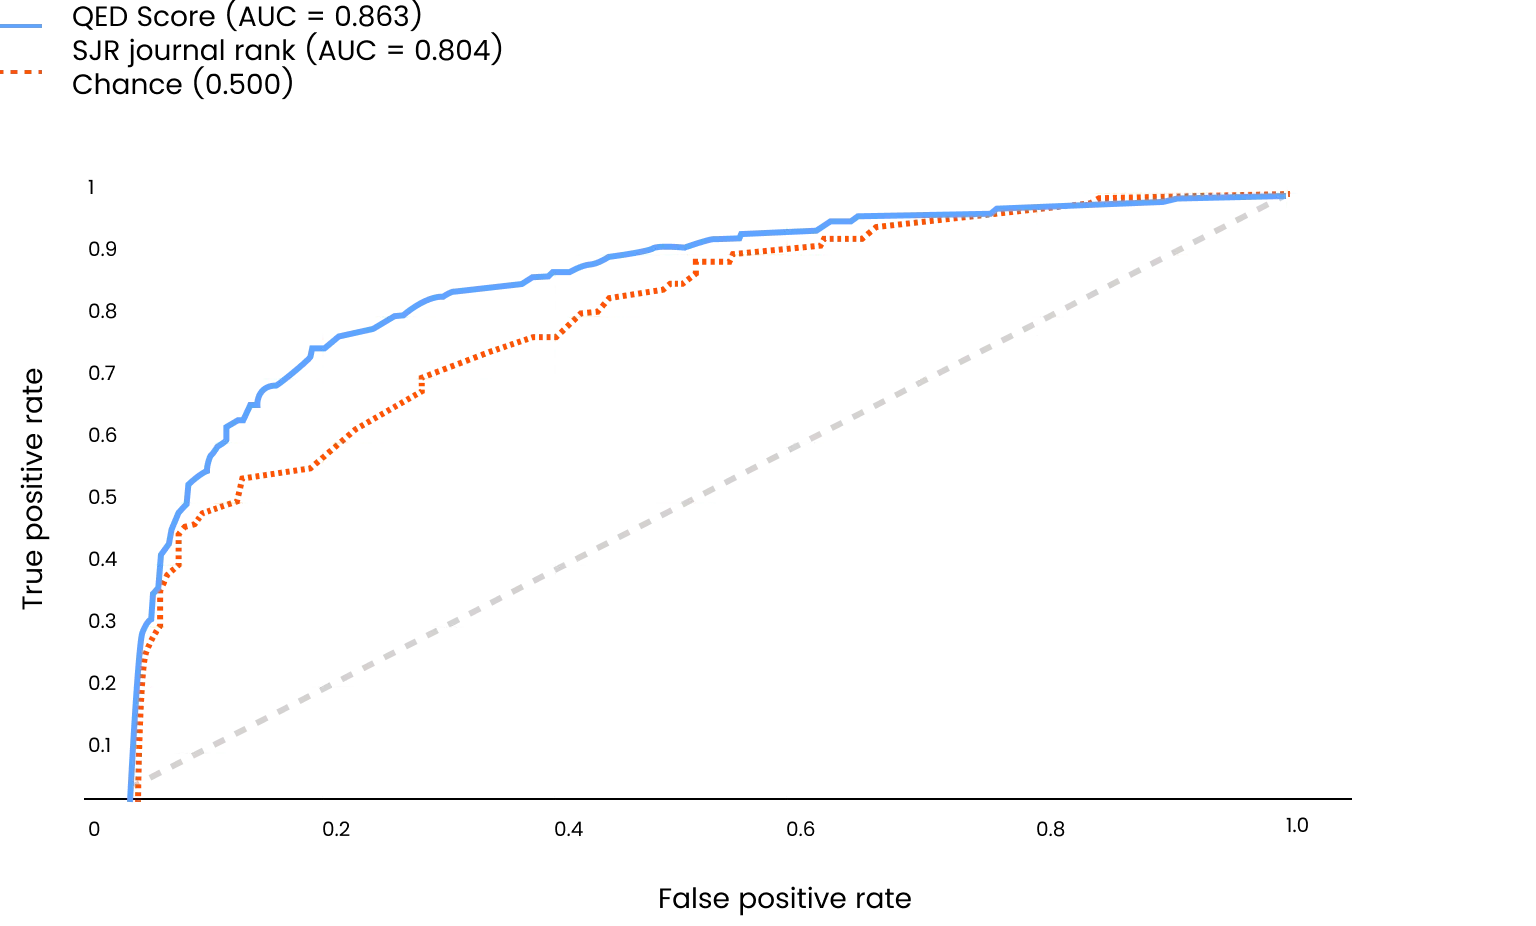
Figure 4 shows the ROC curves for QED Score and SJR journal rank on the same matched subset of 795 papers (those for which both a QED Score and an SJR value were available). Plotting both signals on the same subset allows a direct, like-for-like comparison of discriminative ability. On Strong vs the rest QED Score is comparable to SJR, while for Limited vs the rest QED Score clearly outperforms SJR: for identifying Limited papers (Figure 4), QED Score achieves AUC = 0.863 versus SJR's 0.804; for identifying Strong papers, QED Score achieves AUC = 0.782 versus SJR's 0.774.
4.2 Study 2 — QED Score on preprints predicts eventual journal rank
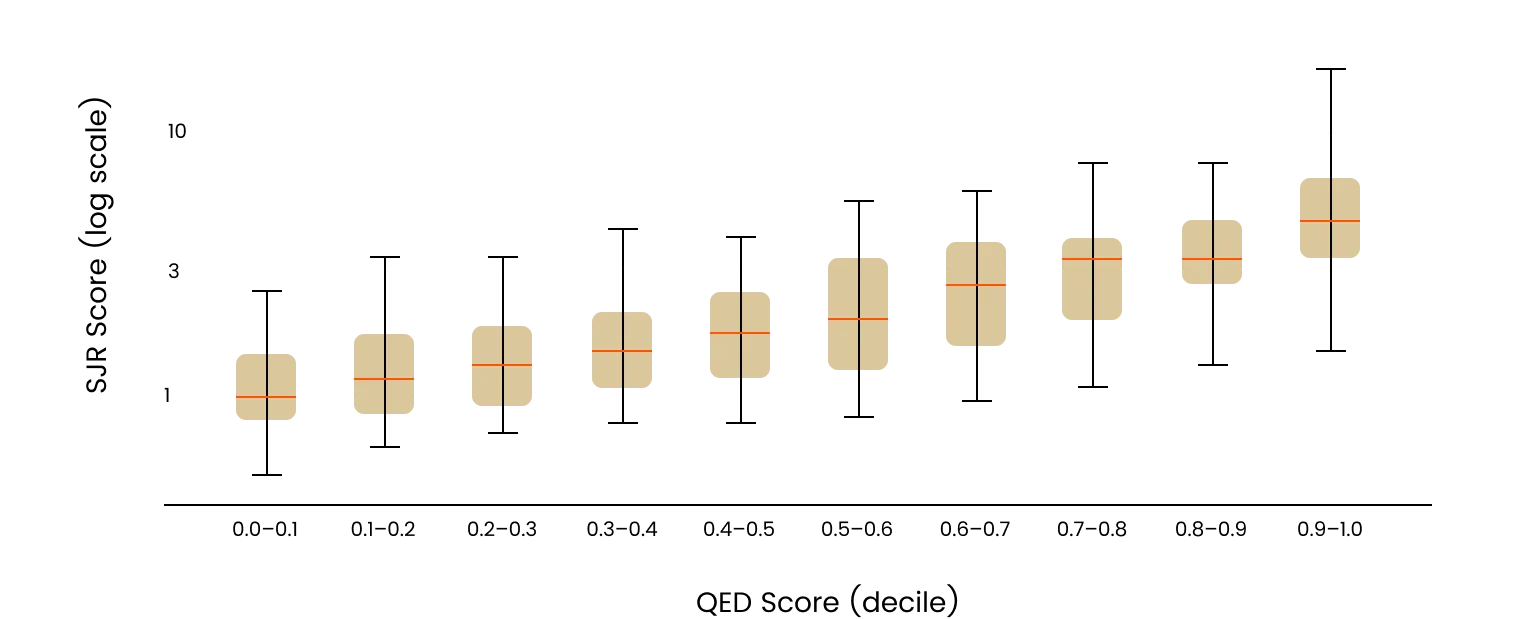
Across the 2,879 matched papers, QED Score computed on the preprint correlated with the SJR of the eventual publication venue at Spearman ρ = 0.63 — substantial agreement between an AI assessment of unreviewed work and the outcome of formal peer review months later, on papers the underlying models had never seen.
We also performed field-level analysis on this data. Because QED Score is intended to work across the life sciences, we asked whether its agreement with journal rank is held within individual disciplines rather than only in aggregate, where a strong overall correlation could mask uneven performance. Correlation was statistically significant in all 21 qualifying fields (n>=30), ranging from ρ = 0.78 in Genetics to ρ = 0.39 in Systems Biology, indicating consistent, although uneven performance across disciplines. The lowest correlations were in Bioinformatics (ρ = 0.49), Ecology (ρ = 0.45), and Systems Biology (ρ = 0.39).
We offer two non-mutually-exclusive explanations for this pattern, noting that neither was tested directly with experts in these fields and both should be tested in future work. First, QED Score analysis is weighted toward mechanistic reasoning, which traces how a claim follows from its evidence and how far it advances a causal account of a system. Fields such as Systems Biology, and Bioinformatics contain a larger share of descriptive, observational, and methods/tool papers, whose quality criteria differ from those of mechanistic discovery work; QED Score is optimized for the latter (See Section 2), so some degradation here is expected. Second, these same fields publish across a more heterogeneous set of venues, which makes SJR itself a noisier proxy for quality. A lower QED–SJR correlation partly reflects weakening of the reference signal, not necessarily of QED Score itself. Distinguishing these two contributions will require running the blinded expert discrepancy protocol (§3.3) within each field.
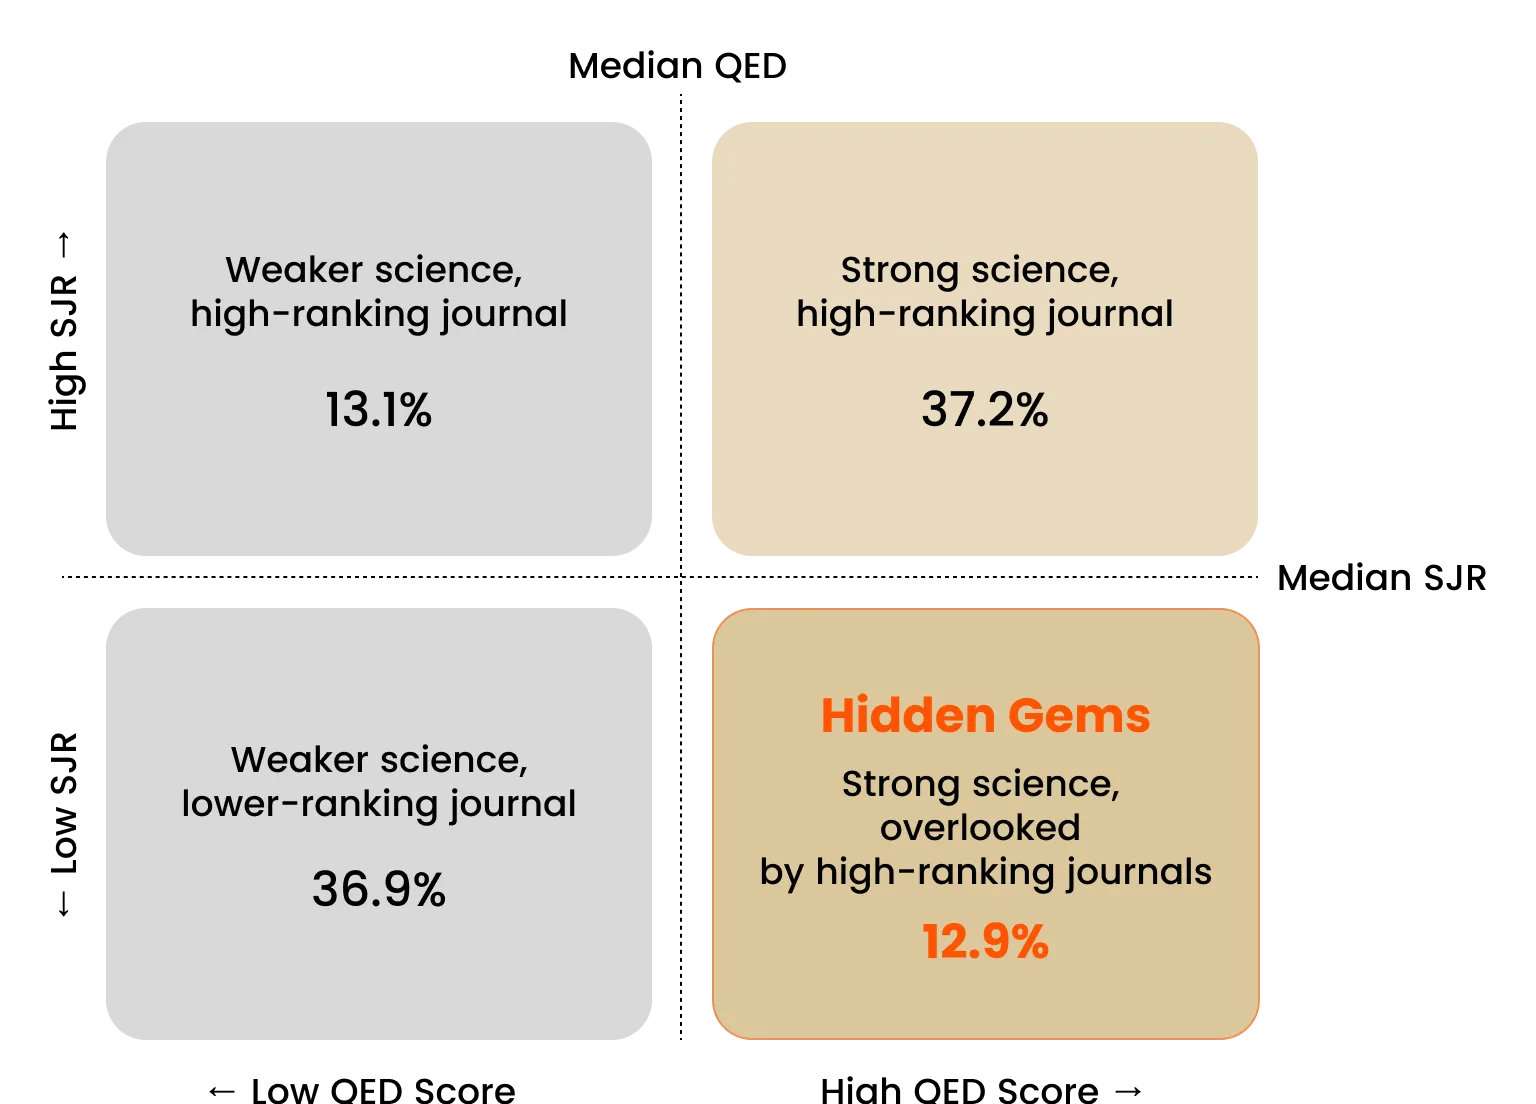
These results show that QED Score, computed on a preprint, can anticipate the rank of the journal in which it will eventually appear. They also show that a meaningful fraction of preprints are published in journals whose rank does not match their QED Score, the disagreements examined directly in Study 3.
4.3 Study 3 — Where paper quality judgements disagree, experts side with QED Score
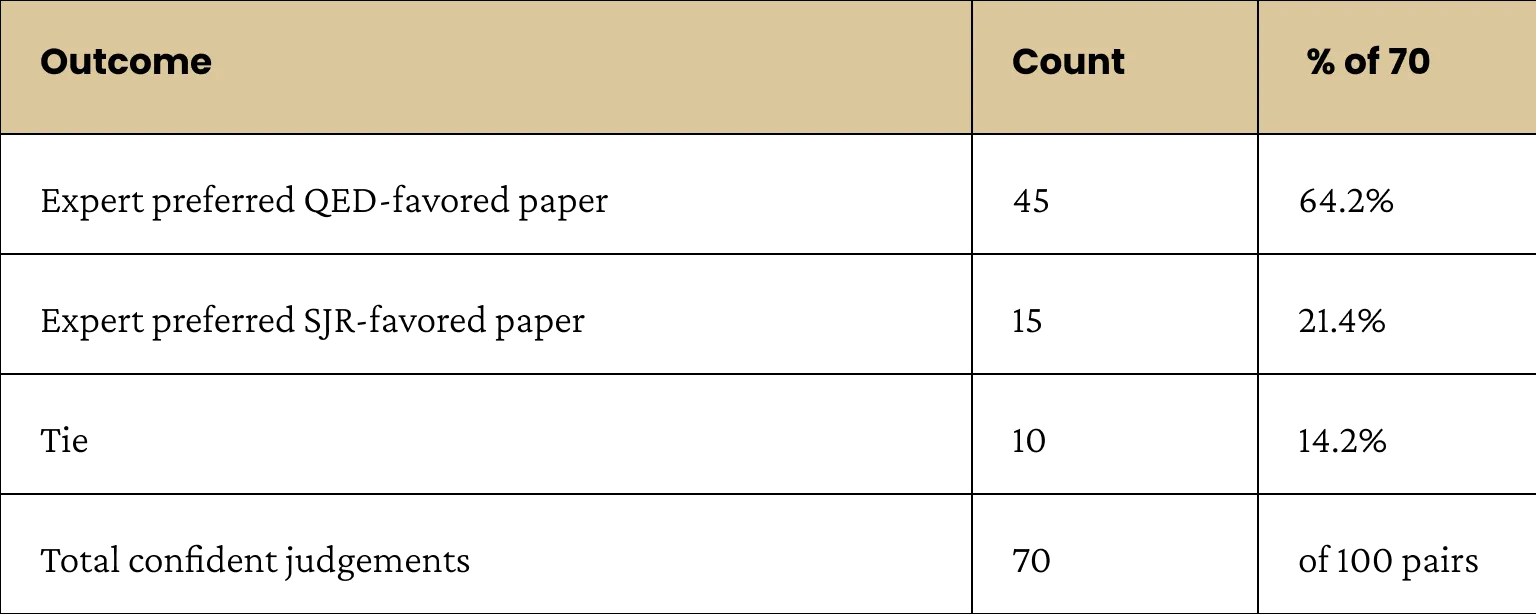
On the 100 contradiction pairs, experts rendered a total of 70 confident judgements spanning 18 distinct biorxiv categories. Among these 70, they preferred the QED-favored paper in 45 cases (64.2%), SJR-favored paper in 15 cases (21.4%), and rated 10 (14.2%) as ties (Table 3).
Restricting our analysis to the 60 decisive judgements (excluding ties), experts sided with QED Score in 75% of cases (95% Wilson CI 63%–84%). A two-sided exact sign test rejects equivalence between QED Score and SJR at p < 0.001, and experts preferred the QED-favored paper 3× more often than the SJR-favored paper. Counting ties as half-credit gives a consistent 71.4% (95% CI 60–81%). Because the lower bound of the confidence interval sits well above the 0.50 equivalence line, the data support a claim of superiority over SJR, not merely non-inferiority.
In short, where an AI score and journal rank disagree, blinded experts judged the AI score to be the better reflection of true paper quality.

5. Limitations and Scope
No single metric captures every dimension of scientific quality. QED Score is designed as a first-pass assessment to be interpreted alongside, not in place of, expert peer review.

6. Conclusion
Across three independent studies, a quality score generated by AI from the manuscript text alone behaved like a meaningful estimate of paper quality. It agreed with expert tiering (AUC 0.867), it predicted eventual journal rank when computed on preprints the models had never seen (ρ = 0.63, n = 2,879), and where it disagreed with journal rank, blinded domain experts judged it the better indicator of true quality in 75% of decisive cases (p < 0.001). Crucially, it delivers this assessment on pre-published work in anonymized form, before the prestige and identity biases and the months-long latency of peer review come into play.
A signal that surfaces strong and original work, one that is fast, paper-level, and available the moment a manuscript exists can be applied not to one paper but to the whole literature at once. Such a capability is relevant wherever consequential decisions rest on the balance of published evidence.
Our studies suggest that an AI-generated score on pre-published work is potentially a better estimate of paper quality than the metrics currently relied upon (chiefly journal rank) and that it can serve as a fast, less biased first-pass signal that augments human judgement. Used this way, it is more than a triage tool: it is a step toward a continuously assessed scientific corpus, one that lets scarce human expertise be spent where it matters most and helps both people and machines act on the best available evidence rather than the most prominently published.
About QED Science
QED Science is an AI company on a mission to surface the best science, and celebrate the scientists behind the manuscripts. Built on the belief that scientific quality should speak for itself, QED Science has developed QED Score, a validated quality metric that evaluates life science manuscripts on originality and validity after full anonymization, removing the influence of author reputation, institutional prestige, and publication venue. In use by more than 10,000 laboratories across 1,500 institutions in over 70 countries, QED Score delivers assessments in minutes that typically take months. Beyond discovery, QED's validity engine empowers researchers to understand which claims hold up across papers, grants, and their day-to-day scientific work, without training on proprietary data. The 1%, QED Science's selection of the most exceptional life science preprints, is the largest blind quality assessment of preprint science conducted to date.
To learn more, visit www.qedscience.com
Appendix A: Terminology and Statistical Definitions
To keep the evaluation self-contained, we define the principal terms and statistical quantities used throughout.
- SCImago Journal Rank (SJR). A journal-level prestige metric that weights the citations a journal receives by the influence of the citing journals, producing a single value assigned to all papers published in that journal in a given year. We use it as the reference proxy for journal rank, an important but imperfect indicator: widely available and comparable across venues, yet assigned at the level of the journal rather than the individual paper.
- Journal Impact Factor. A related venue-level metric based on mean citations per article over a fixed window; cited here as background, not used as the primary comparator.
- ROC-AUC (area under the ROC curve). The probability that a randomly chosen positive case (e.g. a Strong paper) receives a higher score than a randomly chosen negative case. AUC = 1.0 is perfect discrimination; AUC = 0.50 is chance.
- ROC curve. The plot of true-positive rate against false-positive rate across all score thresholds, from which AUC is computed. ROC stands for Receiver Operating Characteristics and is a remnant from the origin of the term.
- Spearman's rank correlation coefficient (ρ). A non-parametric measure of monotonic association between two ranked variables, ranging from −1 to +1; comparing relative ordering without requiring strict linear relationship.
- Bootstrap confidence interval. An interval estimated by resampling the data with replacement (here 2,000 iterations) and reading the empirical percentiles; used for the AUC estimates.
- Exact (binomial) sign test. A distribution-free test of whether two options are chosen equally often; used for the head-to-head expert preferences. Its p-value is the probability, were the two options truly equivalent (preference 0.50), of a split at least as lopsided as the one observed.
- Wilson confidence interval. A confidence interval for a binomial proportion that behaves well at moderate sample sizes; reported for expert-preference rates.
- log1p. The transform log(1 + x), used to compress the heavily skewed SJR scale when constructing contrasting paper pairs.
- Anonymization. Automated removal of author names and institutional affiliations from the manuscript prior to scoring.
Acknowledgements
The authors thank the following domain experts for their participation in the blinded expert evaluation study (Study 3). Reviewers assessed paper pairs within their own areas of expertise and were not involved in the design or analysis of the study. Listed alphabetically by surname.
Amos Bouskila, Associate Professor, Department of Life Sciences, Ben-Gurion University of the Negev, Israel. Expertise: Organismal biology and ecology.
Barak Rotblat, Professor, Department of Life Sciences, Ben-Gurion University of the Negev; National Institute for Biotechnology in the Negev (NIBN), Israel. Expertise: Cancer biology, lncRNA biology, and mRNA translation regulation.
Pedro Escoll, Group Leader, Department of Microbiology, Institut Pasteur, Paris, France. Expertise: Molecular biology, cell biology, and immunology.
Ryan A. Flynn, Associate Professor, Department of Stem Cell and Regenerative Biology, Harvard University; Stem Cell Program, Boston Children's Hospital, USA. Expertise: RNA biology and stem cell biology.
Roi Gazit, Principal Investigator, Shraga Segal Department of Microbiology, Immunology and Genetics, Ben-Gurion University of the Negev, Israel. Expertise: Immunology.
Bluma Lesch, Associate Professor, Department of Genetics, Yale University, USA. Expertise: Genetics and epigenetics.
Jennifer Resnik, Assistant Professor, Department of Life Sciences, Ben-Gurion University of the Negev, Israel. Expertise: Neuroscience.
Liron Rozenkrantz, Senior Lecturer, Azrieli Faculty of Medicine and Gonda Multidisciplinary Brain Research Centre, Bar-Ilan University, Israel. Expertise: Human neuroscience, psychobiology, and mind-brain-body interactions.
Vinodh J. Sahayasheela, Postdoctoral Researcher, Human Biology-Microbiome-Quantum Research Centre (WPI-Bio2Q), Keio University, Japan. Expertise: Chemical biology and host-microbiome interactions.
Ran Zalk, Researcher, Department of Life Sciences, Ben-Gurion University of the Negev, Israel. Expertise: Molecular biology. (approval pending)
We also thank researchers from whom we did not receive consent to name here in time for this publication
References
[1] González-Márquez R, Schmidt L, Schmidt BM, Berens P, Kobak D. The landscape of biomedical research. Cell Patterns. 2024;5(4):100968. doi:10.1016/j.patter.2024.100968
[2] Baldwin M. Scientific autonomy, public accountability, and the rise of "peer review" in the Cold War United States. Isis. 2018;109(3):538–558. doi:10.1086/700070
[3] Rothwell PM, Martyn CN. Reproducibility of peer review in clinical neuroscience: is agreement between reviewers any greater than would be expected by chance alone? Brain. 2000;123(9):1964–1969. doi:10.1093/brain/123.9.1964
[4] Bornmann L, Mutz R, Daniel HD. A reliability-generalization study of journal peer reviews: a multilevel meta-analysis of inter-rater reliability and its determinants. PLoS One. 2010;5(12):e14331. doi:10.1371/journal.pone.0014331
[5] Cole S, Cole JR, Simon GA. Chance and consensus in peer review. Science. 1981;214(4523):881–886. doi:10.1126/science.7302566
[6] Begley CG, Ellis LM. Drug development: raise standards for preclinical cancer research. Nature. 2012;483(7391):531–533. doi:10.1038/483531a
[7] Ioannidis JP. Why most published research findings are false. PLoS Medicine. 2005;2(8):e124. doi:10.1371/journal.pmed.0020124
[8] Giannakakos V, et al. Impact of author characteristics on outcomes of single- versus double-blind peer review: a systematic review. Scientometrics. 2024. doi:10.1007/s11192-024-05213-x
[9] Proceedings of the National Academy of Sciences. Article and Journal Metrics. https://www.pnas.org/about/article-journal-metrics [accessed June 2026]
[10] Phillips KA, Horn DM. Review and Publication Times and Reporting Across Journals on Health Policy. JAMA Network Open. 2025;8(5):e2512545. doi:10.1001/jamanetworkopen.2025.12545
[11] Andersen MZ, Fonnes S, Rosenberg J. Time from submission to publication varied widely for biomedical journals: a systematic review. Current Medical Research and Opinion. 2021;37(6):985–993. doi:10.1080/03007995.2021.1905622
[12] Elsevier/International Center for the Study of Research. Journal acceptance rates analysis. 2020. [Consistent with Biology Open Editorial Team. Biology Open 2024 — a year in review. Biology Open. 2025. doi:10.1242/bio.062121]
[13] Aczel B, Szaszi B, Holcombe AO. A billion-dollar donation: estimating the cost of researchers' time spent on peer review. Research Integrity and Peer Review. 2021;6:14. doi:10.1186/s41073-021-00118-2
[14] Liang W, Zhang Y, Cao H, Wang B, Ding DY, Yang X, Vodrahalli K, He S, Smith DS, Yin Y, McFarland DA, Zou J. Can large language models provide useful feedback on research papers? A large-scale empirical analysis. NEJM AI. 2024;1(8). doi:10.1056/AIoa2400196
[15] Lu C, Lu C, Lange RT, Foerster J, Clune J, Ha D. The AI Scientist: towards fully automated open-ended scientific discovery. arXiv:2408.06292. 2024.
[16] bioRxiv. About bioRxiv. Cold Spring Harbor Laboratory. https://www.biorxiv.org/about-biorxiv [accessed June 2026]